 With the federal election just two weeks away, many are still scrambling to decide which name they should tick off on the ballot.
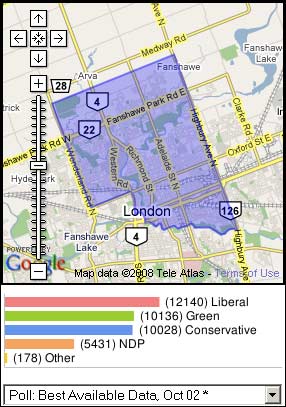
A friend of mine turned me on to an interesting Google Maps mashup which allows you to enter your postal code and see an estimation of the latest poll results for your riding.
The tool is designed with strategic voting in mind.
It is a pro-environment leaning website, and the goal of the authors is to see the Liberals, NDP, Bloc, and Greens win the most seats in the house of commons. Therefore, the website makes recommendations about which of these three parties you should strategically vote for in a particular riding to shut the Conservatives out of a seat.
However, even if you are a Conservative voter, you may still be interested to see how your candidate is doing in the latest polls.
I highly recommend checking it out.
The website is Vote For Environment / Voter Pour l’Environnement.

You really should clarify that the riding polling numbers are not based on actual polls conducted in the riding. Rather, it’s an extrapolation of the national numbers. And a rather questionable one at that. Check out punditsguide.ca for an excellent post on the dangers of uncritical strategic voting.
Dear Miss Vicky:
According to the website:
So it is a mix between the 2006 results and the latest national poll results. This is the best they can do given that polls are not conducted riding by riding in Canada (it would be too expensive, probably).
There are some ridings where the editors of the website use some pretty fuzzy math to come up with the figures. But in the description, they do explain that the figures are “adjusted” to take account of certain factors, such as recent unpopularity of a candidate.
I have revised my post to indicate that the numbers they give are an “estimate.”